BACKGROUND
TrueVision Financial Dashboards give construction companies real-time, company-wide view of financial performance—aggregating data from estimates, change orders, client selections, and invoicing into a unified set of visual reports. Rather than pulling numbers manually from separate tools or relying on periodic accounting reconciliations, these dashboards surface live financial intelligence directly within ConstructionOnline.
Financial reporting in TrueVision is organized into two complementary dashboards: Financial Dashboards, which focus on project value, invoicing status, and change order activity, and Profitability Dashboards, which break down estimated and actual gross profit across multiple dimensions of the portfolio.
FILTERS
The following filters are available across both the Financial and Profitability Dashboards.
Note: ConstructionOnline, by default, sets each Filter category to display "All."
By expanding the Filters feature, you can choose to filter by -
![]()
- Created Date: Select the date range to focus on projects within a specific timeframe.
- Project Status: View live and/or pending projects.
- Project Type: Narrow results based on project types.
- Project Group: Refine the list using company-defined groupings.
- Project Stage: Focus on a specific phase of the project lifecycle.
- Project Category: Filter based on project categories.
- Project Office: View projects associated with a specific office location.
- Project Division: Isolate projects tied to a particular business unit.
- Project Region: Compare projects across different geographic regions.
- Tags: Narrow results using any tags applied to projects.
- Client: View projects associated with a specific client.
To clear established Filters, you can -
- Select the white X next to the specific Filter category you want to revert back to "All."
- Use the blue "Clear Filters" text next to the ❌ to reset the table to the default filters of "All" for each category.
FINANCIAL DASHBOARDS
The Financial Dashboards provide a high-level view of portfolio-wide financial activity—covering total and average project value, pending financial obligations, invoicing status, and the cumulative impact of change orders. Data is drawn automatically from OnCost™ Estimating, Change Orders, Client Selections, and Invoicing records already active in ConstructionOnline and updates in real time as your team works. 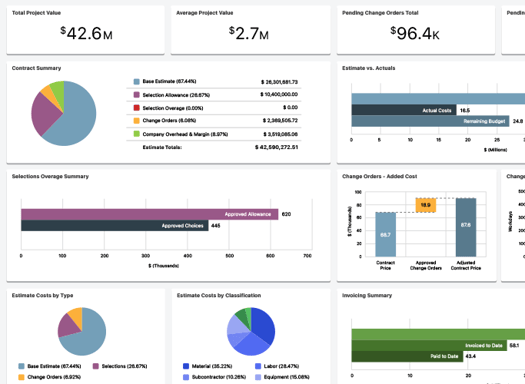
WIDGETS
- Total Project Value: The combined contract value of all active projects in the company portfolio
- Gives owners and financial leaders an immediate read on the total scale of work currently under management. Useful for capacity planning, bonding, and high-level business reviews
- Average Project Value: The mean contract value across all active projects
- Benchmarks the typical size of work the company pursues and completes; shifts in this number over time can signal changes in project mix, client profile, or business strategy
- Pending Change Orders Total: The total dollar value of change orders that have been submitted but not yet approved
- Tracks revenue that is in play but not yet secured. A persistently high pending value may indicate a bottleneck in the client approval process
- Pending Invoices Total: The total dollar value of invoices that have been issued but not yet paid
- Makes outstanding receivables visible at the portfolio level so financial teams can prioritize follow-up and ensure billing is keeping pace with work completed
- Project Value by Type: Breakdown of total project value segmented by project type (e.g. new construction, remodel, commercial)
- Reveals which types of work make up the largest share of the portfolio by value. Useful for identifying where the company is most active and where growth opportunities may exist
- Project Value by Stage: Breakdown of total project value segmented by project stage (e.g. in progress, complete, closing)
- Shows how value is distributed across the project lifecycle, helping leaders understand how much work is in early stages versus actively underway versus nearing completion
- Invoicing Summary: A visual summary of invoicing status across the portfolio, including amounts invoiced, paid, and outstanding
- The clearest single view of billing health, identifying where invoiced amounts are lagging behind work completed, or where payment collection needs attention
- Change Order Added Cost & Time: The cumulative added cost and schedule time attributed to approved change orders across active projects
- Quantifies the real financial and schedule impact of scope changes across the portfolio. Essential for understanding how change orders are affecting both project budgets and delivery timelines
EXAMPLE
A general contractor reviews the Financial Dashboards mid-year and notices the Pending Change Orders Total is significantly higher than usual for this point in the season. Cross-referencing Change Order Added Cost & Time reveals that several large projects have accumulated substantial unapproved scope changes. The project manager uses that data to prioritize client conversations around change order approvals, preventing a situation where completed work goes uncompensated because approvals were never formally closed out.
PROFITABILITY DASHBOARDS
The Profitability Dashboards shift the focus from project value and billing activity to margin performance—comparing estimated gross profit against actual gross profit, and breaking that profitability data down across every meaningful dimension of the portfolio. Each breakdown widget uses gross profit percentage as its metric, making it possible to compare profitability fairly across projects of different sizes and contract values.
Profitability data is drawn from OnCost Estimating, Change Orders, and Client Selections and reflects the current state of each project in real time. 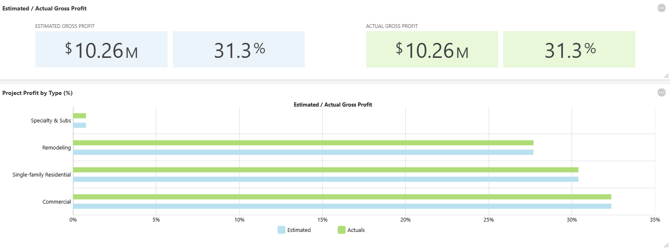
WIDGETS
-
Estimated / Actual Gross Profit: Side-by-side comparison of the estimated gross profit and the actual gross profit to date across the portfolio
- The gap between estimated and actual gross profit reveals whether the company is consistently delivering on its margin targets or whether cost overruns are systematically eroding profitability.
- Project Profit by Type (%): Gross profit percentage broken down by project type
- Identifies which types of work are consistently most profitable and which are underperforming. Essential for making informed decisions about which project categories to pursue more aggressively or price more carefully
- Project Profit by Stage (%): Gross profit percentage broken down by project stage
- Reveals whether profitability tends to deteriorate at a particular stage in the project lifecycle, which can point to cost control issues, scope creep patterns, or estimating gaps at specific phases
-
Project Profit by Region (%): Gross profit percentage broken down by geographic region
- Surfaces regional performance differences that may reflect labor market conditions, material costs, competition, or the effectiveness of regional project management. Useful for companies operating across multiple markets
- Project Profit by Office (%): Gross profit percentage broken down by office or branch location
- Allows multi-office companies to compare performance across locations, identifying which offices are consistently hitting margin targets and which may benefit from additional support or process review
-
Project Profit by Category (%): Gross profit percentage broken down by project category
- Enables granular profitability analysis within the portfolio. Useful for companies that organize work by client type, funding source, or internal classification and want to understand margin performance at that level
-
Project Profit by Group (%): Gross profit percentage broken down by project group
- Supports profitability analysis for companies that organize projects into defined groups, whether by project amount, client relationship, or internal business unit
-
Project Profit by Division (%): Gross profit percentage broken down by division
- Gives companies with divisional structures a clear view of how each division is performing against margin expectations, supporting internal accountability and resource allocation decisions
EXAMPLE
A residential builder uses Project Profit by Type (%) and finds that kitchen and bath remodels are consistently delivering 4-6% lower gross profit than new construction projects. Estimated / Actual Gross Profit confirms the gap isn't an estimating problem—actuals are tracking close to estimates—it's that the remodel category is being estimated at thinner margins to begin with. That insight prompts a pricing review for the remodel division, resulting in adjusted markup targets for the following quarter.
🗒️ Note: The Profitability Dashboard breakdown widgets—by Type, Stage, Region, Office, Category, Group, and Division—reflect the project attributes configured in your ConstructionOnline Company Account. Widgets for dimensions that have no data (e.g. Project Profit by Divisions if no divisions are configured) will display accordingly. Ensure project attributes are consistently assigned for the most accurate and complete profitability analysis.
ADDITIONAL INFORMATION
- For a high-level overview of all TrueVision tools, see Overview: What is TrueVision™ Business Intelligence?
- Subscription Level: ConstructionOnline's TrueVision Business Intelligence is available for companies using ConstructionOnline subscriptions at the Business or Enterprise level.
-
CO™ Mobile App: Currently, the TrueVision feature is exclusively available through browser access to ConstructionOnline.
HAVE MORE QUESTIONS?
- If you need additional assistance, chat with a ConstructionOnline Specialist by clicking the orange Chat icon in the bottom left corner or visit the UDA Support Page for more options.