Construction data is often spread across multiple tools and reports, making it difficult to see how projects and overall business performance are tracking in real time.
TrueVision Business Intelligence in ConstructionOnline™ provides a set of dashboards and reports that bring this information together within the platform, allowing teams to monitor performance, track financial position, and identify issues across projects as they develop without exporting data or building reports manually.
➡️ Tip: Want a guided walkthrough of TrueVision in action?
Watch the on-demand webinar Data Driven Decisions for ConstructionOnline: TrueVision Business Intelligence for a full feature overview and live demonstration.
THE TRUEVISION TOOLKIT
TrueVision includes six core toolsets, each focused on a different part of your business.
SALES DASHBOARDS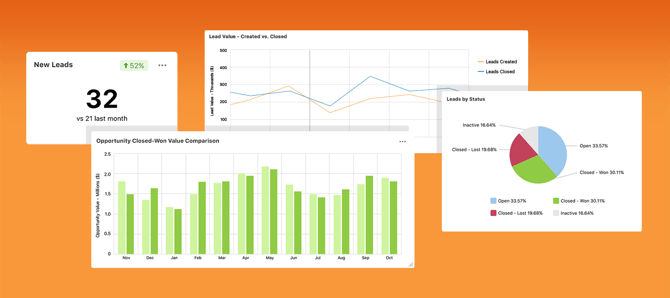
Sales Dashboards show how your pipeline is moving across four dedicated tabs—Overview, Leads, Opportunities, and Sales Rep—giving teams a focused view of each area of sales activity.
You can track:
- New leads and Opportunities over time
- Closed-won and close-lost values
- Performance by sales rep
- Activity levels based on calls, messages, notes, and events
These views help teams understand what's driving conversions, where deals are stalling, and how individual reps are performing.
PROJECT HEALTH SCORECARDS
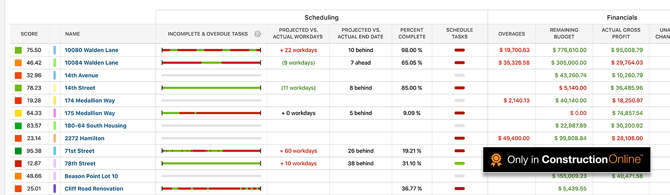
Project Health Scorecards deliver a single, scannable view of how every active job is performing, without opening each project individually. Schedule progress, budget vs. actuals, task completion rates, overdue items, and unresolved RFIs are all visible company-wide, with color-coded indicators that make problem areas immediately obvious.
You control what affect each project's score. You can:
- Set custom thresholds for when status indicators change
- Choose which events, deficiencies, and activities factor into health calculation
- Filter view by region, role, project type, or any combination of criteria.
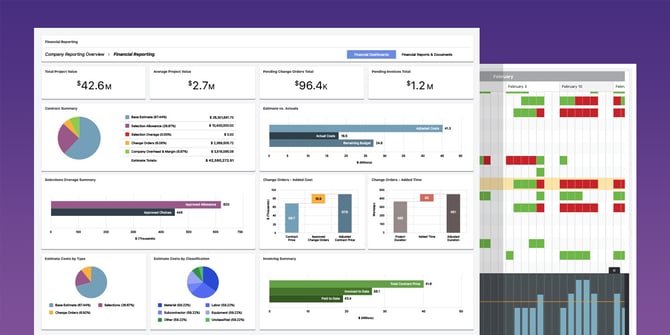
FINANCIAL DASHBOARDS
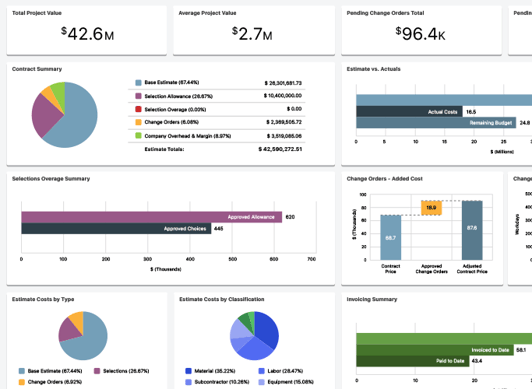
Financial Dashboards aggregate data from estimates, change orders, client selections, and invoicing into a unified view of company-wide financial performance. Leaders get real-time visibility into estimated and actual gross profit values, remaining balances, invoiced amounts, and project value by type, stage, or region.
You can track:
- Estimated and actual gross and net profit values
- Remaining balances and invoiced amounts
- Project value by type, stage, or region
- Projected cash inflows and outflows via Cash Flow Reporting
WORK-IN-PROGRESS (WIP) REPORTING
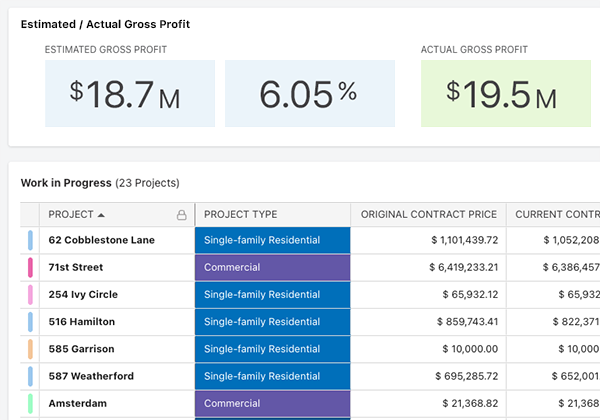
WIP Reporting shows where each job stands between contract value, costs to date, earned revenue, and billing status. Over- and under-billing positions are visible at a glance across every active job at any point in the project lifecycle—not just at month-end close.
You can track:
- Contract value vs. costs to date
- Earned revenue and billing status
- Over- and under-billing status
MULTI-PROJECT SCHEDULING

Multi-Project Scheduling consolidates all active project timelines together into one unified Gantt view, making it possible to see how individual jobs relate to each other across the portfolio. Start and end dates, percent complete, and milestone status are all visible without navigating project by project, and schedule bars can be adjusted with a single drag.
You can track:
- Schedule progress and percent complete across all active jobs
- Upcoming milestones across days, weeks, and months ahead
- Schedule drift via baseline comparison
RESOURCETRAK™
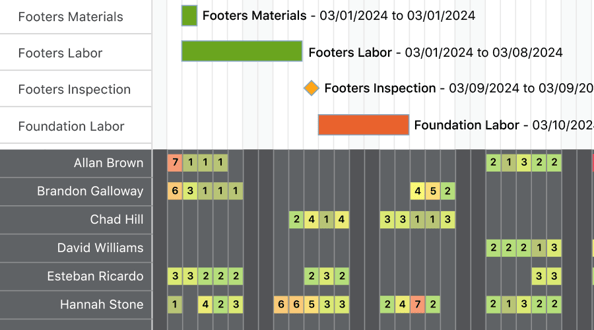
ResourceTrak makes resource planning visible at the company level, showing who is assigned to what, when conflicts are developing, and where capacity is running thin across all active projects. Users can view utilization across the entire portfolio or narrow to a single schedule.
You can track:
- Resource workload, availability, and task conflicts
- Overloaded resources and scheduling conflicts before they affect delivery
- Capacity limits configured at the company level or per individual contact
WHO BENEFITS FROM TRUEVISION?
TrueVision is designed to support decision-making across multiple roles within a construction company. The following list outlines which toolsets are most relevant to each user group:
- Executives & Owners: Project Health Scorecards, Financial Dashboards, WIP Reporting
- Project Managers: Project Health Scorecards, Multi-Project Scheduling, ResourceTrak
- Sales Teams: Sales Dashboards (Leads, Opportunities, Rep Performance)
- Financial Teams: Financial Dashboards, WIP Reporting, Cash Flow Reports
- Operations Leaders: Multi-Project Scheduling, ResourceTrak, Project Health Scorecards
By bringing these perspectives together, TrueVision ensures that teams across the company operate from a shared view of project and business performance—eliminating data silos and the guesswork that comes with them.
HOW TRUEVISION WORKS
TrueVision does not require separate data entry or manual reporting. Its insights are drawn automatically from the tools and records already in use across the ConstructionOnline platform:
- OnPlan™ Scheduling data powers Project Health Scorecards, Multi-Project Scheduling, and ResourceTrak.
- OnCost™ Estimating, Change Orders, Client Selections, and Invoicing data powers Financial Dashboards and WIP Reporting.
- CRM & Sales activity from Lead Tracking and Opportunities populates Sales Dashboards.
Because TrueVision is fully integrated with the platform, insights update in real time as your team works—without requiring manual data transfers, reconciliation, or third-party reporting tools.
ACCESSING TRUEVISION IN CONSTRUCTIONONLINE
TrueVision is accessible within ConstructionOnline from the Left Sidebar or the Company Selector in the Top Navigation Bar under the TrueVision Intelligence tab. No additional installation or setup is required. TrueVision automatically pulls data from the tools and records already active on your Company Account.
ADDITIONAL INFORMATION
- TrueVision Ebook: Download the TrueVision Business Intelligence ebook for additional details and real-world examples of how TrueVision dashboards and reporting tools support data-driven decision-making.
- Subscription Level: ConstructionOnline's TrueVision Business Intelligence is available for companies using ConstructionOnline subscriptions at the Business or Enterprise level.
- TrueVision tools are also available as Per-Company Add-Ons for all other plans.
-
CO™ Mobile App: Currently, the TrueVision feature is exclusively available through browser access to ConstructionOnline.
HAVE MORE QUESTIONS?
- If you need additional assistance, chat with a ConstructionOnline Specialist by clicking the orange Chat icon in the bottom left corner or visit the UDA Support Page for more options.