BACKGROUND
The TrueVision Project Health Scorecard gives construction companies a single, company-wide view of how every active project is performing—without opening each job individually. Scheduling progress, financial standing, task activity, communication status, and time tracking data are all consolidated into one scrollable table, with color-coded scoring that makes problem areas immediately visible and healthy jobs easy to recognize at a glance.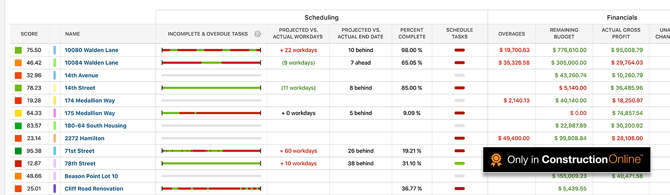
Each row in the scorecard represents one active project. Columns are organized into five sections—Scheduling, Financials, Project Tracking, Communication, and Time Tracking—each of which can be shown, hidden, or reordered to match your team's priorities. Every project receives a score based on configurable thresholds, giving leaders a consistent, objective basis for evaluating performance across the entire portfolio.
🗒️ Note: You can access the Project Health Scorecards section of ConstructionOnline via the TrueVision Intelligence tab in the Left Sidebar or the Company Selector in the Top Navigation Bar.
NAVIGATING THE SCORECARD
The Project Scorecard opens to a table listing all active projects in your ConstructionOnline's Company Account. The header displays the total project count, and a Search Projects bar in the top right allows users to quickly locate a specific job by name. A Filters panel at the top of the table lets teams narrow the view by project attributes such as stage, region, or role—useful for focused portfolio reviews or team-specific check-ins.
Each project row displays its Score in the first column, followed by Name and Stage, then the data columns organized by section. Column visibility and order are fully customizable, and all configuration is managed from the gray three-dot Action Menu ![]() in the top right of the scorecard.
in the top right of the scorecard.
SCORECARD SECTIONS & COLUMNS
The scorecard includes five sections, with columns in each section that can be shown or hidden as needed.
SCHEDULING
The Scheduling section tracks how each project's timeline is progressing relative to its planned milestones and completion targets. The columns are driven by data from OnPlan™ Scheduling and update automatically as Schedule Tasks are completed or dates change.
- Schedule Percent Complete: Visual progress bar showing how far along the Schedule is, calculated by multiplying each task's workdays by its percent complete value, then dividing by total scheduled workdays
- Compare multiple projects' Schedule progress side by side to quickly identify which jobs are advancing on pace and which may need attention
- Projected vs. Actual Workdays: The discrepancy between the projected workdays for the Schedule and the actual workdays logged to date
- Positive values indicate the project is running ahead; negative values signal the Schedule is being stretched—catch slippage before it compounds
- Projected vs. Actual End Date: The discrepancy between the projected end date for the Schedule and the current actual end date
- The clearest indicator of whether a project will deliver on time—flag this early to have a client conversation before the deadline arrives
- Percent Complete: The overall completion percentage for the project Schedule
- A straightforward completion benchmark useful for status reporting and client-facing updates
- Schedule Tasks: Color-coded indicator summarizing the state of Schedule Tasks
- Quickly surface projects where Tasks are piling up or running overdue
FINANCIALS
The financials section surfaces cost and billing data pulled directly from OnCost™ Estimating, Change Orders, Client Selections, and Invoicing. Financial values can be displayed in currency format ($0.00) or as percentages (0.00%)—configured in Project Scorecard Settings.
- Overages: The amount by which actual costs have exceeded the budgeted amount for the project
- The earliest financial warning sign—an overage appearing mid-project signals a cost conversation needs to happen now, not at closeout
- Remaining Budget: The difference between the current project budget and costs incurred to date
- Tells you how much financial runway remains on each job; low remaining budget on an incomplete project is an immediate flag
- Actual Gross Profit: The actual gross profit value based on costs and revenue recorded to date
- Compare against estimated gross profit to see whether individual jobs are delivering the margin the estimate projected
- Unapproved Change Orders: The total value of Change Orders that have been submitted but not yet approved by the client
- Tracks revenue that is in play but not yet secured. High unapproved values on a single job may indicate client communication gap
- Pending Selections: The total value of Client Selections that have not yet been finalized
- Unresolved selections can delay procurement and budgeting; this column makes the exposure visible before it becomes a Schedule problem
- Invoicing: The current invoicing status for the project, including amounts invoiced and outstanding balances
- Quickly identify which projects have outstanding Invoices to ensure billing is keeping pace with work completed
PROJECT TRACKING
The Project Tracking section reflects activity from ConstructionOnline's task and documentation tools, giving project managers a read on how well day-to-day work is being captured and completed across each job.
- To Dos: Status summary of To Do items assigned to the project, including due, overdue, and completed counts
- A high volume of overdue To Dos on a single project is an early indicator of either workload strain or incomplete follow-through
- Daily Logs: Indication of Daily Log activity and recency for the project
- Consistent Daily Logging is a sign of an actively managed job. Gaps in log activity may signal a project that isn't being monitored closely enough
- Punch Lists: Status of open and completed Punch List items for the project
- Critical at closeout—unresolved Punch List items late in a project's lifecycle directly affect final payment and client satisfaction
- Checklists: Completion status of Checklists associated with the project
- Useful for quality control processes and compliance tracking; incomplete Checklists at key milestones can indicate process breakdowns
COMMUNICATION
The communication section tracks unresolved documentation items that require responses from project stakeholders. Overdue items in this section can signal stalled decisions or information gaps that put Schedules at risk.
- Overdue RFIs: The number of Requests for Information that are past their required response date
- Unanswered RFIs are one of the most common causes of construction delays. This column makes overdue items visible at the portfolio level so nothing gets overlooked
- Overdue Submittals: The number of Submittals that are past their required response or approval date
- Delayed Submittal approvals can hold up procurement and installation sequences; tracking this company-wide prevents individual jobs from bottlenecking silently
TIME TRACKING
The Time Tracking section compares planned labor hours against actual hours logged, giving project managers and owners visibility into labor performance and potential overtime exposure across all active jobs.
- Actual vs. Budgeted Hours: Comparison of hours actually worked against the hours budgeted for the project
- The primary labor performance indicator—running significantly over budget on hours mid-project is an early signal of a cost overrun in the making
- Budgeted Hours: The total labor hours budgeted for the project
- Provides the baseline for evaluating whether the project was scoped accurately from a labor standpoint
- Actual Hours: Total hours logged against the project to date
- Tracks real labor consumption and supports accurate job costing as the project progresses
- Remaining Hours: The difference between budgeted hours and actual hours logged to date
- Shows how much labor capacity remains in the budget. Low remaining hours on an incomplete project signals a potential overrun
- Overtime Hours: Total overtime hours logged against the project
- Elevated overtime hours can indicate scheduling pressure, understaffing, or scope creep—useful for identifying which jobs are creating labor cost risk
- Time Tracking: A summarized status indicator of overall Time Tracking health for the project
- A quick-scan indicator for portfolio-level reviews when full column detail isn't needed
PROJECT SCORING
Every project in the scorecard receives a numeric score based on how its data measures the thresholds defined in the Project Scorecard Settings. The score is displayed in the leftmost column of each project row, accompanied by a color-coded indicator that reflects the overall health at a glance—making it possible to identify outliers across the portfolio without reading every column. 
SCORE DISPLAY OPTIONS
The format in which scores are displayed can be configured in Project Scorecard Settings. Four options are available under the Project Score Display Options section of the "View Options" tab:
- Raw Score: Calculated by summing all active project scoring values. Provides the most numerical representation of overall project health.
- Raw Score Rank: Displays a ranking number for each project based on its raw score relative to all other projects in the list. Useful for quickly identifying the top- and bottom-performing jobs across the portfolio.
- Percent Score: Calculated by dividing the raw score by the maximum possible score and multiplying by 100. Normalizes scores so projects can be compared regardless of how many scoring categories are active.
- Percentile: Calculated using the formula (n / N) x 100, where n is the number of projects with a lower score and N is the total number of projects. Indicates where each project stands relative to the rest of the portfolio.
EXAMPLE
A project manager at a mid-size residential builder uses Percent Score display to run a Monday morning portfolio review. Two projects sitting below 50% immediately stand out. Drilling into those two rows reveals one has a growing overage in the Financials section and the other has several overdue RFIs in Communication. Both get addressed before the week's client calls because the scorecard surfaced them in under two minutes.
PROJECT SCORECARD SETTINGS
Project Scorecard Settings is where the scoring logic behind the scorecard is defined. Rather than applying a fixed standard to every company, ConstructionOnline allows each team to configure thresholds that reflect their own performance benchmarks—or select from two pre-built default sets as a starting point. Settings are organized into named sets, and multiple sets can be maintained simultaneously for different project types, teams, or reporting needs.

ACTIVE SETTINGS TAB
The Active Settings tab is where settings sets are created, selected, and managed. ConstructionOnline provides two default sets out of the box:
- Default Set #1: A comprehensive scoring configuration with a maximum per-project score of 2,550, weighting financial performance and project tracking heavily.
- Default Set #2: A lighter-weight configuration with a maximum per-project score of 235, suited for simpler portfolio reviews.
To create a custom set, select (+) Add New Settings & Score Set. Each set in the list displays its Set Name and Max. Score. The active set is indicated by a blue circle to the left of the Set Name. To switch sets, select a different set and click the blue "Save" button. To edit an existing set, select the gray 3-dot Action Menu to the right of the set and press "Manage Settings."
VIEW OPTIONS TAB
The View Options tab controls how certain data is displayed in the scorecard table, independent of scoring thresholds:
- "Schedule Progress" Column Bar: Choose what the progress bar in the Scheduling section represents -
- Schedule Percent Complete
- Projected vs. Actual Workdays
- Projected vs. Actual End Date
- Incomplete & Overdue Tasks
- "Score" Column Bar: Choose how Project Score is displayed -
- Raw Score
- Raw Score Rank
- Percent Score
- Percentile
- Financial Value Display: Choose how financial amounts appear in the scorecard -
- Currency ($0.00)
- Percentage (0.00%)
CONFIGURING THRESHOLDS

THRESHOLDS TAB
When creating or editing a settings set, the Thresholds tab is where scoring logic is defined for activity-based features across Scheduling, Financials, Project Tracking, Communication, and Time Tracking. Each feature row shows its maximum possible score and its maximum share of the total project score as a percentage, making it clear how much weight each feature carries relative to the whole.
Each feature can be individually toggled ON or OFF. When turned off, that feature is excluded from scoring entirely. Active features define thresholds across three color bands:
🟢 Green: The healthy range. Meeting the Green threshold adds a positive score value to the project.
🟡 Yellow: The caution range. Falling into Yellow typically contributes a neutral score (0), flagging the item for attention without penalizing the project.
🔴 Red: The critical range. Reaching Red applies a negative score value, pulling the project's overall score down.
Each feature has condition rows that can be set independently:
- Overdue: Triggers based on items that are already past due. For example, a Schedule Task threshold might be set Green at 0 overdue items, Yellow at 1-4, and Red 5 or more.
- Due within the next [X] days: A forward-looking condition that flags items approaching their due date before they become overdue. The number of days is configurable per feature, allowing teams to build in an early-warning window suited to their workflow.
🗒️ Note: The maximum per-project score displayed in the top right of the Settings panel reflects the sum of all active feature scores in the current set. As features are toggled on or off and score values are adjusted, this number updates automatically.
ESTIMATING TAB
The Estimating tab defines how financial values are scored based on percentage thresholds rather than item counts. This tab uses Green / Black / Red color band (rather than Green/Yellow/Red) and applies to three calculated financial values:
- Overages: Calculated by dividing the sum of all estimate category overages by the sum of the categories' adjusted costs. A lower percentage is better—Green scores indicate the project is tracking within budget, while Red scores signal meaningful cost overruns relative to the estimate.
- Remaining Budget: Calculated by subtracting the actual costs from the adjusted costs. Expressed as a percentage of the adjusted cost, this value shows how much financial runway remains on the project.
- Actual Gross Profit: Calculated by subtracting the Best Estimate of Job Costs from the Current Contract Price. A higher percentage indicates a healthier margin—thresholds here reward projects tracking above a defined gross profit target and flag those falling below it.
TIME TRACKING TAB
The Time Tracking tab defines scoring for labor performance using percentage-based thresholds, with a Green / Yellow / Red color band. Two values are tracked:
- Remaining Hours(% of Budgeted Hours): Calculated by subtracting actual hours from budgeted hours, expressed as a percentage of the budget. Thresholds here can be configured to flag projects where labor budget is running critically low before the project is complete.
- Overtime (% of Actual Hours): The percentage of total logged hours classified as overtime. Thresholds reward projects with low overtime rates (Green) and flag those where overtime is becoming a significant share of total labor (Red).
Note: Company Administrators can set Overtime rules in Time Tracking > Pay Period and Overtime Settings.
➡️ Tip: ConstructionOnline's default settings sets are a practical starting point for teams new to Project Health Scorecards. Starting with a default set and adjusting individual thresholds incrementally, rather than building from scratch, makes it easier to calibrate scoring to your company's standards without getting lost in configuration.
ADDITIONAL INFORMATION
- For a high-level overview of all TrueVision tools, see Overview: What is TrueVision™ Business Intelligence?
- Subscription Level: ConstructionOnline's TrueVision Business Intelligence is available for companies using ConstructionOnline subscriptions at the Business or Enterprise level.
- TrueVision's Project Health tools are also available as a Per-Company Add-On for all other plans.
-
CO™ Mobile App: Currently, the TrueVision feature is exclusively available through browser access to ConstructionOnline.
HAVE MORE QUESTIONS?
- If you need additional assistance, chat with a ConstructionOnline Specialist by clicking the orange Chat icon in the bottom left corner or visit the UDA Support Page for more options.